 Sneha Kataria
Learning SQL is often about syntax, but understanding how to apply it to real-world business challenges is equally important. While many tutorials focus on teaching SQL commands, they often miss explaining the thought process behind solving actual data problems.
In this blog, I share insights from my own SQL practice sessions, breaking down business problems into queries while illustrating the approach to visualizing and solving them. We’ll start with some fundamental queries and gradually build complexity. To follow along, you can use the Walmart sales dataset for data analysis in PostgreSQL.

Setting Up Your Database
Before diving into queries, the first step is to create a table in PostgreSQL and upload the dataset. Use the following CREATE TABLE command to structure your database with appropriate column names and data types.
CREATE TABLE Query
This query creates a new table named “walmart_sales” with specified columns and their data types. It defines the structure for storing Walmart sales data with appropriate constraints.
CREATE TABLE walmart_sales(
    invoice_id VARCHAR(15),     -- string with maximum length of 15 characters.
    branch CHAR(1),
    city VARCHAR(25),
    customer_type VARCHAR(15),
    gender VARCHAR(15),
    product_line VARCHAR(55),
    unit_price FLOAT,      -- stores numeric values with decimal places.
    quantity INT,     -- stores integers
    vat FLOAT,
    total FLOAT,
    date date,
    time time,
    payment_method VARCHAR(15),
    rating FLOAT
);
Here is how the table will be created after the above query run:

Now it is time to feed the data into the table. Once that is done, you can run the below query to select all records and it will display all the records. It can also verify that all the data has been transferred to the SQL Database.
SELECT * from walmart_sales;
Business Problems
Find the total sales amount for each branch.
Branch Total Sales Query: This query calculates total sales by branch. It uses SUM() to aggregate sales and GROUP BY to get branch-wise totals.
SELECT branch,     -- filtering branch column.
SUM(total) as branch_total     -- adding the sales total for each branch and naming it.
FROM walmart_sales
GROUP BY branch;       -- now grouping the branch column to get the total.
Result:
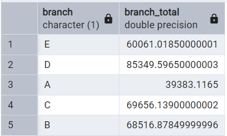
Insights:
The Branch D is performing well with the highest sum of sales whereas Branch A needs to make adjustments to increase its sale.
Calculate the average customer rating for each city.
City Average Rating Query: This query finds average customer ratings for each city using AVG() function and groups results by city.
SELECT city,
AVG(rating) as Avg_rating     -- calculating the average rating for each city.
FROM walmart_sales
GROUP BY city;     -- now grouping the city column to get distinct value for each city.
Result:
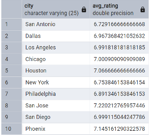
Insights:
The average customer rating is between 6 and 7.25 which is good in comparison to each other. New plans and strategy should be made to increase the ratings in the city where the average is below 7.
Count the number of sales transactions for each customer type.
Customer Type Sales Count Query: This query counts sales transactions by customer type (member/non-member) using COUNT(*) and GROUP BY.
SELECT customer_type,
COUNT(*) as total_sales     -- counting each sale made.
FROM walmart_sales
GROUP BY customer_type;     -- grouping by  customer_type column to get total sales made by each type.
Result:
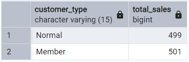
Insights:
The number sales made by members and non-members is almost the same in 3 months, hence new discounts and offers could be generated to get more customers to convert into taking the membership. Incentives are not high.
Find the total quantity of products sold for each product line.
Product Line Quantity Query: This query sums up quantities sold for each product line using COUNT(quantity) and GROUP BY.
SELECT product_line,
COUNT(quantity) as total_quantity     -- Counting total quantity in a new column.
FROM walmart_sales
GROUP BY product_line ;     -- grouping by product_line column to combine the quantity for each category.
Result:
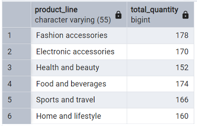
Insights:
Health and Beauty department sold slightly less than other departments. So to increase the sales, new ads and offers needs to be launched.
Calculate the total VAT collected for each payment method.
Payment Method VAT Query: This query calculates total VAT collected for each payment method using SUM(vat) and GROUP BY.
SELECT payment_method,
SUM(vat) as total_vat     -- adding the vat for each payment method.
FROM walmart_sales
GROUP BY payment_method ;     -- now grouping the payment_method column to get total by each method.
Result:
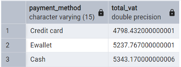
Insights:
This data shows people prefer cash or Ewallet transactions more to regulate their spendings. Hence, we could provide smooth credit card transaction process and low rates on high-cost transactions to save customers some bucks.
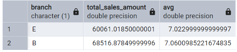
Find the total sales amount and average customer rating for each branch.
Branch Sales and Rating Query: This query combines total sales and average ratings per branch, using multiple aggregations (SUM and AVG) with GROUP BY.
SELECT branch,
SUM(total) as total_sales_amount,     -- adding the total sales for each branch.
AVG(rating) as Average_rating     -- calculating the average rating for each branch.
FROM walmart_sales
GROUP BY branch;     -- grouping by branch column to get combined data.
Result:
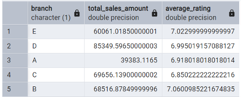
Insights:
Branch D not only has the highest total sales amount but also maintains a good average customer rating, indicating
effective customer service alongside strong sales performance. Branch A, while having lower sales, maintains a
competitive customer rating, suggesting good service quality despite lower sales volume.
Calculate the total sales amount for each city and gender combination.
City-Gender Sales Query: This query analyzes sales by city and gender combinations using GROUP BY with multiple columns and numbered references (1,2).
SELECT city, gender,     -- listing the columns : city is 1 and gender is 2
SUM(total)     -- calculating the total amount of sales.
FROM walmart_sales
GROUP BY 1, 2;      -- grouping the data by city and gender columns to get desired results.
Result:
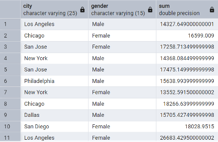
Insights:
The sales distribution across city and gender combinations shows varying patterns of purchasing behavior in different locations. This data can be used to tailor marketing strategies and inventory management specific to each city’s gender-based purchasing patterns.
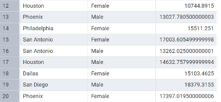
Find the average quantity of products sold for each product line to female customers.
Female Product Line Query: This query calculates average quantity sold to female customers for each product line, using WHERE to filter gender and GROUP BY.
SELECT product_line,
AVG(quantity)     -- calculating the average quantity of product sold.
FROM walmart_sales
WHERE gender = 'Female'     -- filtering only the female customers.
GROUP BY product_line;     -- grouping by the category of the product.
Result:
Insights:
Female customers show different purchasing quantities across product lines, which can help in inventory planning and targeted marketing campaigns. This data can be used to optimize stock levels and create gender-specific promotions.
Count the number of sales transactions for members in each branch.
Member Sales by Branch Query: This query counts member transactions per branch using COUNT and WHERE to filter for members only.
SELECT branch,
COUNT(invoice_id) as No_of_sales      -- counting the sales made by each branch.
FROM walmart_sales
WHERE customer_type = 'Member'     -- only by Walmart members.
GROUP BY branch;     -- grouping by branch column to get combined data.
Result:
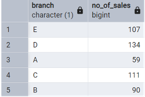
Insights:
The distribution of member sales across branches shows where membership programs are most successful.
This information can be used to analyze and replicate successful membership strategies from high-performing branches to others.
Find the total sales amount for each day. (Return day name and their total sales order DESC by amt)
Daily Sales Query: This query uses TO_CHAR to extract day names from dates and calculates total sales per day, ordered by amount.
SELECT
TO_CHAR (date, 'Day') AS Day_name,     -- extracting day from the time column.
SUM(total) as total_sales_amount       -- calculating total sales made.
FROM walmart_sales
GROUP BY Day_name     -- grouping by day.
ORDER BY total_sales_amount DESC;     -- organising the total sales amount in descending order.
Result:
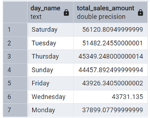
Insights:
Sales show significant variation across different days of the week, which can be used for better staff scheduling and inventory management. Peak sales days can be identified for optimal resource allocation.
Calculate the total sales amount for each hour of the day.
Hourly Sales Query: This query uses EXTRACT to get hours from time stamps and calculates sales totals per hour.
SELECT
EXTRACT ( HOUR FROM time) as hours,     -- extracting hour from the time. Syntax: EXTRACT(part FROM date)
SUM(total) as total_sales_amount     -- calculating total sales.
FROM walmart_sales
GROUP BY hours     -- grouping by day.
order by total_sales_amount;     -- organising the total sales amount in ascending order(default).
Result:
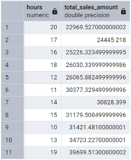
Insights:
The hourly sales pattern reveals peak shopping hours and slower periods, which can be used for staff scheduling,
planning promotional activities, and managing store operations more efficiently.
Find the total sales amount for each month. (return month name and their sales)
Monthly Sales Query: This query converts dates to month names using TO_CHAR and calculates monthly sales totals.
SELECT
TO_CHAR (date, 'month') AS months,     --converts the date into strings, here in months.
SUM(total) as total_sales_amount     -- calculating the total of sales amount.
FROM walmart_sales
GROUP BY months     -- grouping by months.
ORDER BY total_sales_amount DESC;     -- organising the total sales amount in descending order.
Result:
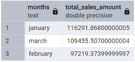
Insights:
Monthly sales variations indicate seasonal trends and can be used for better inventory planning and seasonal promotional strategies.
Calculate the total sales amount for each branch where the average customer rating is greater than 7.
High-Rating Branch Sales Query: This query finds branches with ratings > 7 using HAVING clause with AVG(rating).
SELECT branch,
SUM(total) as total_sales_amount,       -- calculating the total of sales amount.
AVG(rating)     -- calculating the average of ratings.
FROM walmart_sales
GROUP BY branch     -- grouping by branch.
HAVING AVG(rating) > 7;     -- where average rating of the branch is greater than 7.
Result:
Insights:
Branches with high customer ratings (>7) demonstrate strong performance in both sales and customer satisfaction, providing benchmark practices for other branches.
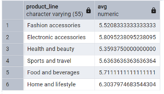
Find the total VAT collected for each product line where the total sales amount is more than 500.
Product Line VAT Query: This query calculates VAT totals for product lines with sales > 500 using HAVING clause.
SELECT product_line,
SUM(vat) as total_vat     -- calculating the total of vat amount.
FROM walmart_sales
GROUP BY product_line     -- grouping by product line.
HAVING SUM(vat) > 500 ;     -- where sum of vat amount is greater than 500.
Result:
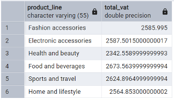
Insights:
Product lines with high VAT collection indicate high-value sales categories, which can be focused on for revenue optimization.
Calculate the average sales amount for each gender in each branch.
Gender-Branch Average Sales Query: This query calculates average sales by gender within each branch using multiple GROUP BY columns.
SELECT branch,
gender,
AVG(total) as branch_total     -- calculating the average of total sales amount.
FROM walmart_sales
GROUP BY branch, gender     -- grouping by branch and gender both.
ORDER BY branch;       -- ordering the data by branch.
Result:
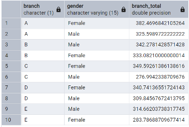
Insights:
Gender-based sales patterns across branches can help in tailoring branch-specific marketing strategies and product placement.
Count the number of sales transactions for each day of the week.
Weekly Transaction Count Query: This query counts transactions per weekday using TO_CHAR for day names.
SELECT
TO_CHAR (date, 'Day') AS Day_name,     --converts the date into strings, here in days.
COUNT(payment_method) as no_of_sales      --calculating total sales made by different payment method on each day.
FROM walmart_sales
GROUP BY Day_name;      --grouping by the day
Result:
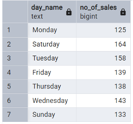
Insights:
Understanding daily transaction patterns helps in optimizing staffing levels and operational hours for different days of the week.
Find the total sales amount for each city and customer type combination where the number of sales transactions is greater than 50.
City-Customer Type Sales Query: This query analyzes sales by city and customer type for locations with >50 transactions.
SELECT city,
customer_type,
SUM(total) as total_sales      --calculating sum of total sales amount.
FROM walmart_sales
GROUP BY city, customer_type       --grouping the data by city and customer_type both.
HAVING COUNT(payment_method) > 50       --providing the results for city where no. of payments are greater than 50.
ORDER BY city;     --ordering the data by city.
Result:
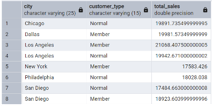
Insights:
The combination of city and customer type data reveals where membership programs are most successful and which
cities have the highest transaction volumes.
Calculate the average unit price for each product line and payment method combination.
Product Line-Payment Method Query: This query calculates average unit prices across product lines and payment methods.
SELECT product_line,     --1
payment_method,       --2
AVG(unit_price) as avg_unit_price     --calculating average unit price for each product line.
FROM walmart_sales
GROUP BY 1 , 2     --grouping by 1 & 2.
ORDER BY product_line;       --ordering by product line.
Result:
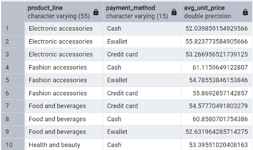
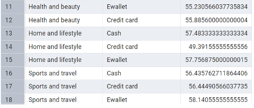
Insights:
Understanding price points across product lines and payment methods can help in pricing strategy and payment method promotions.
Find the total sales amount for each branch and hour of the day combination.
Time Period Sales Query: This uses a CTE (WITH clause) to categorize sales into morning/afternoon/evening periods and calculates totals for each.
SELECT branch,
EXTRACT( HOUR FROM time) AS hour_of_the_day,     --extracting hour from time column.
SUM(total) AS total_sales       --calculating sum of total sales amount.
FROM walmart_sales
GROUP BY branch, hour_of_the_day     --grouping by branch and hour.
ORDER BY branch, hour_of_the_day;      --ordering ths data by branch and hour.
Result:
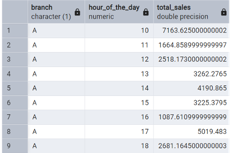
Insights:
The sales pattern across different hours for each branch helps in understanding branch-specific peak hours and
can be used for local operational planning.
Calculate the total sales amount and average customer rating for each product line where the total sales amount is greater than 1000.
This query analyzes high-performing product lines by calculating their total sales and average ratings. It filters for product lines with sales over $1000 using HAVING clause, helping identify successful product categories and their customer satisfaction levels
SELECT product_line,
SUM(total) as total_sales,      --calculating sum of total sales amount.
AVG(rating) as avg_rating       --calculating the average of rating for each product line.
FROM walmart_sales
GROUP BY product_line     --grouping the data by product line.
HAVING SUM(total)  > 1000       --where total sales are greater than 1000.
ORDER BY product_line;      --ordering by product line.
Result:
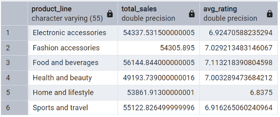
Insights:
High-performing product lines (>$1000 in sales) with their corresponding customer ratings provide valuable information for product focus and improvement areas.
Calculate the total sales amount for morning (6 AM to 12 PM), afternoon (12 PM to 6 PM), and evening (6 PM to 12 AM) periods using the time condition.
This complex query uses a CTE (Common Table Expression) to categorize sales into morning (6 AM to 12 PM), afternoon (12 PM to 6 PM), and evening (6 PM to 12 AM) periods. It then calculates total sales for each time period, helping understand peak sales times and customer shopping patterns throughout the day.
WITH new_table     --creating a new temporary table to convert time into shifts.
AS
(SELECT *,
CASE
WHEN EXTRACT(HOUR FROM time) BETWEEN 6 AND 12 THEN 'Morning'
WHEN EXTRACT(HOUR FROM time) > 12 AND EXTRACT(HOUR FROM time) <= 18 THEN 'Afternoon'
ELSE 'Evening'
END as shifts
FROM walmart_sales)     --extracting morning, afternoon and evening shift from the time column.

SELECT shifts,
SUM(total) as total_sales      --calculating sum of total sales amount.
FROM new_table
GROUP BY shifts;     --grouping the total sales made at each shift.
Result:
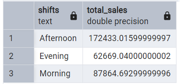
Insights:
The time-of-day analysis shows sales patterns across different periods, which can be used for staffing optimization,
inventory management, and planning promotional activities during peak or slow periods.
 Airbnb: proposing intelligent recommendation using AI