 Sneha Kataria
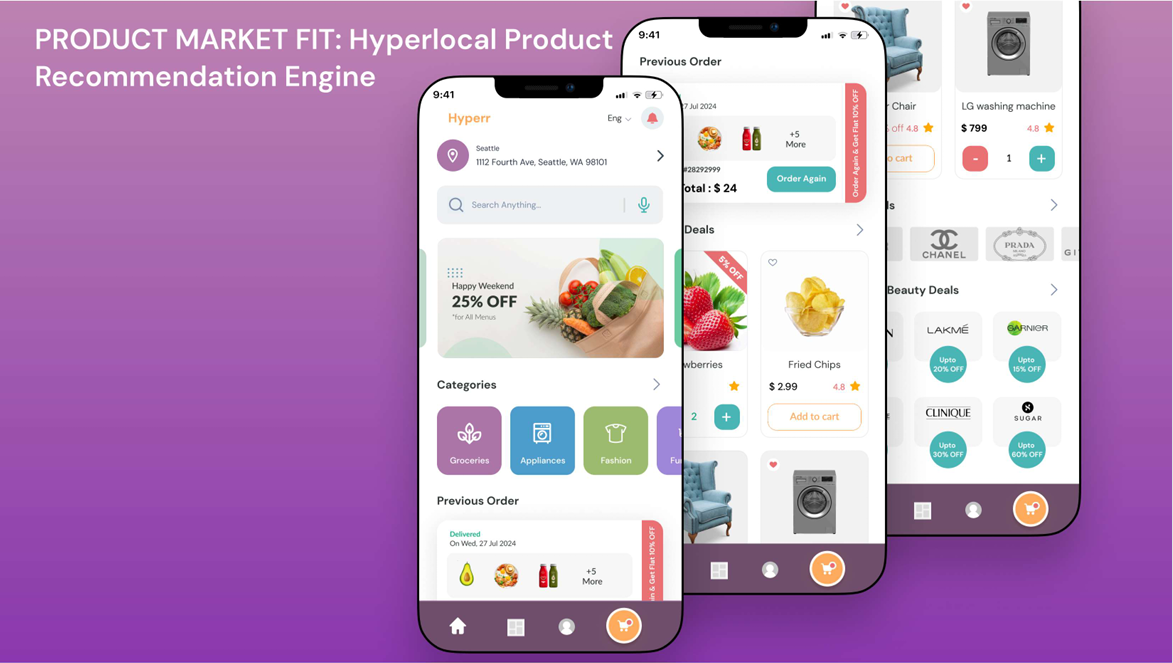
A solution for user to find and order local nearby products based on their preferences in a snap of time and use their time efficiently.

🎯 GOAL
Problem Statement
Users find it difficult to discover local products through existing platforms and getting it delivered to them. Find a solution that increases the discoverability of locally available products and simplifies the delivery based on customer preferences, location, and purchase history.
😶🌫️ Hypothesis Statement
If user can find and order local nearby products based on their preferences in a snap of time, then they will be able to enjoy the personalised experience and use their time efficiently.
🪄 Value Preposition
The Solution provides a customised experience for the user to find the locally available products at their doorsteps, based on their preferences and location.
🌎 MARKET RESEARCH
Hyperlocal eCommerce
Hyperlocal ecommerce is best understood as an online business model in which the needs and demands of customers are quickly met through local offline shops via a hyperlocal ecommerce platform. A hyperlocal delivery model is a natural ingredient for hyperlocal ecommerce to take place. It’s marketplace enables the customers to choose and buy products from closely located and nearby shops. This model has two fundamental dimensions to take care of-geographical proximity and time taken to deliver.
Market Size
As a result of the proliferation of e-commerce platforms, online marketplaces, and delivery-based enterprises, consumer expectations are increasing. Companies that deliver faster than their competitors tend to attract more customers, so the hyperlocal delivery model opens up a slew of opportunities for entrepreneurs.
Increasingly well-funded start-ups, curated products and services, and on-demand delivery have contributed to hyperlocal e-commerce’s popularity. Their success has led to interest and participation by some of the large business houses and online giants.
The hyperlocal delivery industry was worth USD 1,324 billion in 2019 and is expected to grow to USD 3,634 billion by 2027, with a CAGR of 17.9% (source: allied market research).
For United States:
| Countries | Forecast CAGR (2024 to 2034) |
|---|---|
| The United States | 19.40% |
The North American region is anticipated to account for the largest share of the global hyperlocal services market. The growing use of modern technology in daily life is a major driving force in North America, and it is predicted to boost the overall market expansion of the online hyper-local services market over the forecast period.
Factors influencing the shift
- Increasing impatient population has given impetus to the emergence of delivery apps that promote instant gratification, thus setting a new standard for evolving customer expectations.
- Growing demand for convenience and immediate access to goods, often accelerated by factors like: pandemic and changing consumer behavior.
- Several factors have been driving the growth of the hyperlocal services market, including smartphones, urbanization, changing consumer preferences, and improved lifestyles.
This shift is predicted to curtail costs, streamline operations, and drive brand loyalty from a single unified platform.
Advantage over e-commerce :
- Customers can get goods delivered quickly to their homes.
- It has more credibility since products are delivered from local shops to local customers.
- Hyperlocal businesses have a physical location prior to setting up an online presence, so customers can visit them, which makes hyperlocal markets trustworthy.
🙂CUSTOMER DISCOVERY
Insights from the user interviews conducted in person. Link to the interview details : https://docs.google.com/document/d/1s9p1EiCV132CHsOn0pb7Ej-WP1xhPB-N6Z-js8f-Mag/edit?usp=sharing
🔸 Pain Points and Challenges:
- Search:
- Limited filters available in terms of food types that match specific preferences (e.g., dietary needs, sustainable options).
- Too many options but some fail to provide the right product descriptions.
- Recommendation:
- Lack of trust as sponsored products are placed on the top instead of genuinely personalized recommendations.
- Frustration with irrelevant product recommendations on existing platforms.
- Ordering:
- Need to make multiple orders from multiple stores resulting in extra delivery fees.
- Missing price comparison between stores.
- Real-time inventory tracking is missing, Item are available on the app, but OOS in the store.
- Delivery:
- Incorrect order delivery most of the times and wrong delivery destination allocation to the drivers.
- Delivery fee stacking with each step of the ordering process.
- Delayed deliveries of out of stock and heavy items.
- Product Quality:
- Quality of delivered produce is subpar, leading to wastage. Or delivery of raw items, defying the whole purpose of same day usage of instant deliveries.
🤵 USER PERSONA
User- 1
| Demography | Challenges |
|---|---|
| • A Busy Professional (30), Male, New York, Med-high income, Single |
• Making multiple orders from multiple stores causing extra delivery fees • Delivery to wrong address • No variety in recommendation system |
| Motivation | Need |
|
• Deals and discounts • Lower delivery fees |
• Platform that provides variety, reliable delivery |
User-2
| Demography | Challenges |
|---|---|
| • Working mom, Female (38), Fort-Worth (Sub-urban), Mid-high income, Family of 4 (with kids) | • Difficult to get good / preferred quality of products • Limited options for specialized products • Not trustworthy - sponsored products instead of genuinely personalized • Too many brands and no information about the nutrition and make about the products |
| Motivation | Need |
| • Better quality | • Platform which provides better quality product with convenience |
👥 COMPETITIVE ANALYSIS
| Company | Strength | Weaknesses | Opportunities for differentiation |
|---|---|---|---|
| Doordash | • Focused on two-tier cities areas where no-one catered. • Offers customer data insights and other value propositions to partners. |
• Heavy reliance on independent contractors or gig workers. • Difficulty maintaining its competitive edge while managing costs effectively. |
• Drive feature can cater to a broader range of merchants beyond restaurants, including grocery, retail, and other sectors, potentially driving further growth. • Consumer data: Third-party delivery providers control consumer data, which limits restaurants' ability to engage with their customers. • Optimizing delivery operations with a focus on Dashers to drive efficiency and growth. |
| Grubhub | • Extensive restaurant network. • Innovative marketing strategies. |
• Dependence on restaurants. • Focuses predominantly on food delivery. |
• Onboarding multiple partners of other sectors on the platform. • Improvement in recommendation system offering suggestions for diverse needs. |
| Instacart | • Strong partnership with numerous local and national retail chains. • 24/7 customer support through their website and social media platforms. • Strong foothold in grocery delivery. |
• Delivery is costly • Search results are often broken and do not show accurate output • You get bad shoppers if you’re not tipping well |
• Delivery is costly |
INSIGHTS FROM USER RESEARCH AND COMPETITIVE ANALYSIS AND VALIDATION CHECK LIST
| Problem | Validation |
|---|---|
| Delivery Issues • Unreliable delivery times. • Wrong or missing items in order delivery. • Delivery to wrong or incomplete destinations. • Poor communication with delivery personnel. • Items left in unsafe or inconvenient locations (e.g., lobby, sidewalk). |
“One delivery guy told me I could find my groceries on the sidewalk in front of my building.” “Driver claimed they knocked, but nobody approached my door. Checked the camera, no one came.” |
| Relevance and Accuracy • Irrelevant Recommendations: Users receive suggestions for products or content that do not match their interests or recent activity. • Overly Generic Recommendations: Repeatedly showing the same products or generic options that lack personalization. • Poor Context Understanding: Recommendations fail to account for nuanced search terms, preferences, or user behavior. |
“The app keeps suggesting items I’ve already bought instead of showing me new options.” “It feels like I’m stuck in a loop— every time I open the platform, it shows the same set of recommendations. Where is the personalisation or variety?” |
| Price and Fees • High delivery fees making orders expensive. • Price discrepancies between app and in-store. • Hidden fees that inflate the final cost (e.g., tax, delivery fee, tips). |
“I found Instacart deceptive and expensive; like, the prices may be 'okay', but then factor in the tax, delivery fee, heavy item fee, tip, some other random fees.” “I have an Instacart membership and almost never use it now because it ends up being so much more expensive than going to the grocery store.” |
| Search and Inventory Issues • Inaccurate search results (e.g., irrelevant or no items found). • Limited product availability in the app compared to the store. • No ability to use search modifiers (e.g., “-chocolate”). • Incorrect or outdated inventory information. |
“If I search Christmas fuzzy socks - for some reason it thinks I meant 'chocolate' and only gives me chocolate items.” “I search for the shorts by the name I got from the app itself and the shorts don't show up.” |
😢PROBLEM STATEMENTS
Delivery Inefficiency
Users face issues with the assignment of the delivery partners and accurate delivery destination causing delayed deliveries leading to user frustration, wasted time and trust issues in the brand name.
Validation:
Product Discovery and recommendation
Users find it difficult to discover locally available products due to lack of suggestions/searches which are provided to them, as sponsored products are promoted on the top. This leads to frustration and confusion for the user and missed opportunities to explore readily available local products.
Product ordering and inventory management
Users face issue with ordering multiple products from multiple stores because of limited inventory or availability in a particular store causing extra delivery fee which makes customers to reconsider ordering from the hyperlocal ecommerce platform
Inaccurate product information and price comparison
User find a lack of information about product description among similar products due to incomplete details listed on the platform and no price comparisons between stores saving money for the user, causes confusion and makes it tedious for user to find the right product.
🍚 PRIORITISATION BASED ON RICE FRAMEWORK
| Problem | Reach | Impact | Confidence | Effort | RICE Score |
|---|---|---|---|---|---|
| Delivery Inefficiency | 9 | 10 | 10 | 10 | 90 |
| Product Discovery and Recommendation | 8 | 9 | 8 | 8 | 72 |
| Product Ordering and Inventory Management | 6 | 7 | 8 | 7 | 48 |
| Inaccurate Product Information and Price Comparison | 4 | 4 | 5 | 6 | 13.33 |
Hypothesis structure:
The top-ranked problem from rice framework was delivery inefficiency but that requires more time and resources. So, considering hyperlocal product discovery and recommendation as the key problem to solve here.
Clear problem statement:
Users struggle in finding products locally when the platform shows a generic range of products that are not personalized based on the user’s preferences and shopping history while heavily promoting the sponsored products. Users also feel dejected when the ambiguous products shows up in the search results which makes the product discovery more time consuming.
Impact on Users:
This problem leads to user disappointment. Personalised recommendations at the top of the search results can save time and make the process quick and easy for the user. Searching for locally available products and getting vague results leads to confusion in user experience resulting in user ordering items which are not available immediately.
Primary target users:
Frequent urban and rural shoppers: Prefers to shop online more than 3 – 4 times a week and aged between 18-45 years. They choose convenience and time saved over in-store shopping.
Value Proposition:
For users, our MVP provides improved search results with AI- personalized recommendations of locally available products based on user preferences and search history. Using real time delivery updates from optimized routes to manage user frustration, resulting in more efficient and a customised shopping experience.
Core Features:
| Feature | Description |
|---|---|
| Recommendation feature | AI-personalised suggestions based on user preferences and search history. |
| Price comparison feature | Resulting in showing everyday low prices across the store for a particular product. |
| Live Inventory Update | Real-time Updation of OOS items for more transparency in product availability. |
| Better Search results | Accurate search results by recommending relevant keywords for the search bar. |
| Efficient Delivery update using AI-optimisation | Real-time optimisation of routes using AI for generating the shortest route to the destination for quick delivery. |
| Local warehouse set-up | Setting up small warehouses locally in areas based on order demands and location. |
| Deals and Discounts | Gamification of deals and passes for better engagement and experience. |
FEATURE PRIORITISATION LIST (USING Moscow method)
| FEATURE | PURPOSE / SOLUTION | PRIORITY |
|---|---|---|
| Login/Sign-up | Allows user to Login/Signup in the app securely. | MUST-HAVE |
| Onboarding guides | Guides/ Pop-ups to direct the onboarding flow of the user. | MUST-HAVE |
| Selective 5-products preference | To allow user to select preferred 5- product categories to provide initial recommendations. | SHOULD-HAVE |
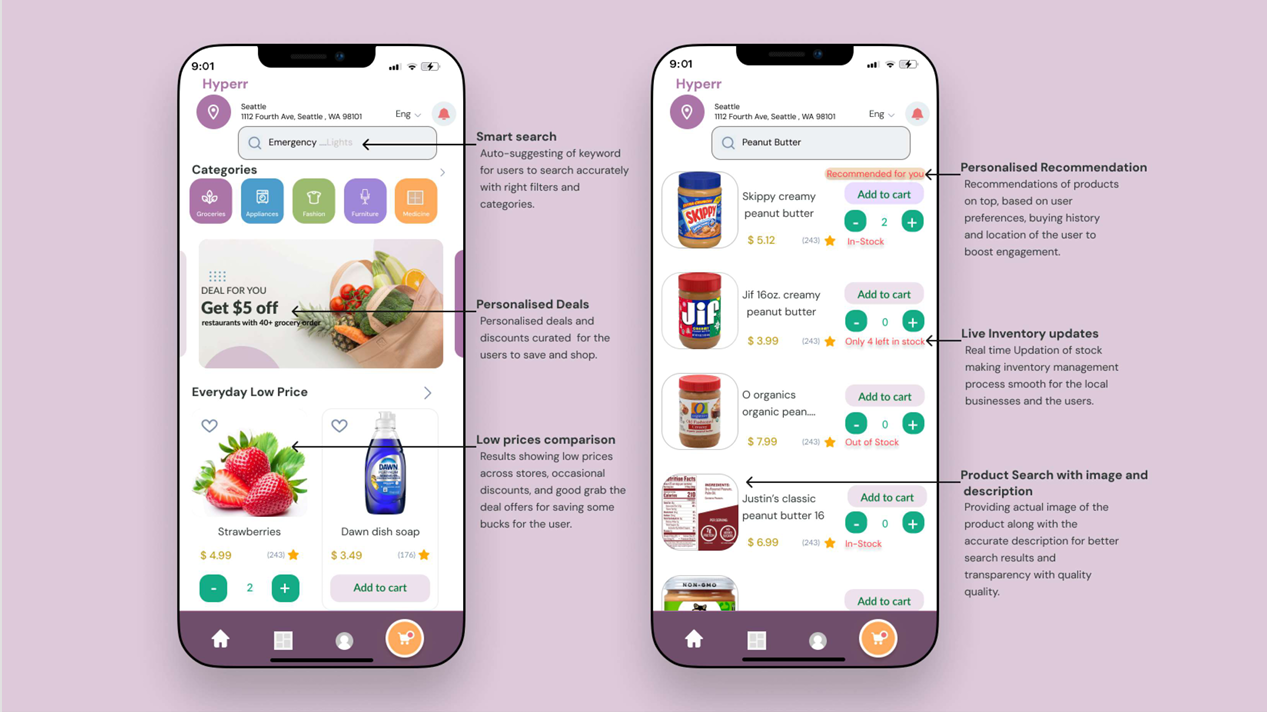
| Smart Search keyword | Auto-suggesting of keyword for user to search accurately with right filters and categories. | MUST-HAVE |
| Recommendation and Suggestions | Recommendations of products based on user preference, buying history and location of the user to boost engagement. | MUST-HAVE |
| Product Search with image and description | Providing actual image of the product along with the accurate description for better search results. | SHOULD-HAVE |
| Price comparison/Daily deals & discounts | Results showing low prices across stores, occasional discounts, and good grab the deal offers for saving some bucks for the user. | MUST-HAVE |
| Live Inventory updates | Real time Updation of stock making inventory management process smooth for the local businesses and the users. | MUST-HAVE |
| Flexible order system | Letting user order from multiple stores without incurring additional charges and minimum order limits. | MUST-HAVE |
| Real-time order tracking | Real time GPS- tracking and getting notifications for on-time deliveries. | MUST-HAVE |
| Optimisation of routes | AI-optimized route suggestions to the delivery partner for early deliveries. | MUST-HAVE |
| Correct delivery ETA prediction | Exact delivery time prediction based on the route selected by the delivery partner to avoid delays and disappointment. | MUST-HAVE |
| Quality assurance measure | Delivering the fresh products and providing replacements and refunds to build more trust in the company. | MUST-HAVE |
| Subscription plans and rewards | Recurring daily/weekly based subscriptions and rewards for 100 order completion for attracting cost-sensitive users. | SHOULD-HAVE |
| Push notifications | Notifying the user about the daily deals and low prices to make the process cost effective for the user. | SHOULD-HAVE |
| Hyperlocal warehousing | Setting up warehouses locally in areas based on order demands and location. | COULD-HAVE |
| Multi-payment option | Providing flexible payment options like card, google pay, apple pay or wallet for convenience. | SHOULD-HAVE |
| User profile management/ Updation | Letting user add or update their personal information, address etc. | MUST-HAVE |
| Wishlist | Allowing making Wishlist for saving and buying it later items for future purchases. | COULD-HAVE |
| Customer Support & Help | Providing the user to connect with the brand for any issues or resolutions over the chat or call and FAQs. | MUST-HAVE |
Feature Request Sample :
![]()
⭐ NORTH STAR METRICS
North star metric - Daily Active Users (DAUs)
It tracks user engagement, ensuring the app has strong active user base, especially among recommended product discovery segment. The increase in DAUs indicates that the proposed solutions are enhancing engagement, helping user remain actively engaged with the platform.
SECONDARY METRICS
| Metric | Frequency | Goal |
|---|---|---|
| Adoption rate: Number of users downloaded the app and made an account. | Weekly, monthly, quarterly | 20% initial engagement and signups |
| Auto search word prediction: How much the search is made with auto-search suggestions. | Monthly | Using the predicted keyword at least once per product search. And multiple search suggestions used by the user in 3 months for deeper engagement. |
| Impressions: Number of times a recommended product is displayed to potential customers and is ordered/added to cart. | Weekly, monthly | Minimum one recommended product is added to the cart per order. |
| Engagement rate: Level of interaction with the recommended product listing. | Weekly, monthly, quarterly | Using recommendation feature for the first time and multiple times over the next orders. |
| Sales conversion rate: Percentage of users who completed a purchase, a core metric to track overall sales performance. | Weekly, monthly | 20% of users making 2 weekly sales using recommended items at least once while ordering. |
| Average order value: Average amount spent per customer purchase. | Quarterly | Order value of $25 or more. |
| Return rate: Percentage of users who leave a website after viewing only one page, indicating potential issues with product page content. | Quarterly | 40% of users returning for another session within 7 days. |
| Churn Rate: Percentage of customers that leave over a period of time. | Monthly | 5% decrease in drop-off in user workflow. |
| CTR recommendation click-through rate. | Weekly | 10% increase in recommendation feature clicks over total impressions. |
| Customer retention rate: Percentage of customers who make repeat purchases, highlighting customer loyalty. | Monthly | 60% of users returning for another session within 7 days. |
| NPS Score: Measurement of customer loyalty based on how likely they are to recommend your product to others. | Monthly / Quarterly | Gradual increase in user satisfaction with the recommended products. |
| Referrals and feedback | Using referrals to invite their friends, leaving 4+ stars rating for the app, providing user feedback. |
 Mastering SQL Through Real-World Business Problems