 Sneha Kataria
Built using MS Excel to analyse supplier-wise brand performance and category growth
Objective
- Accelerate Revenue Growth
Use historical profit trends and category-wise brand performance to tap into emerging opportunities and improve margins across under-leveraged suppliers. - Optimize Go-to-Market Strategy
Refine pricing, sales, and product rollout strategies by evaluating brand-category performance and identifying underserved market segments. - Enable Strategic Decision-Making
Back business decisions with data-driven insights on brand performance across categories and timeframes to guide long-term planning and expansion. - Strengthen Supplier Competitiveness
Evaluate brand-wise contribution from each supplier to identify market dominance, gaps, and opportunities for introducing new competitive partnerships.
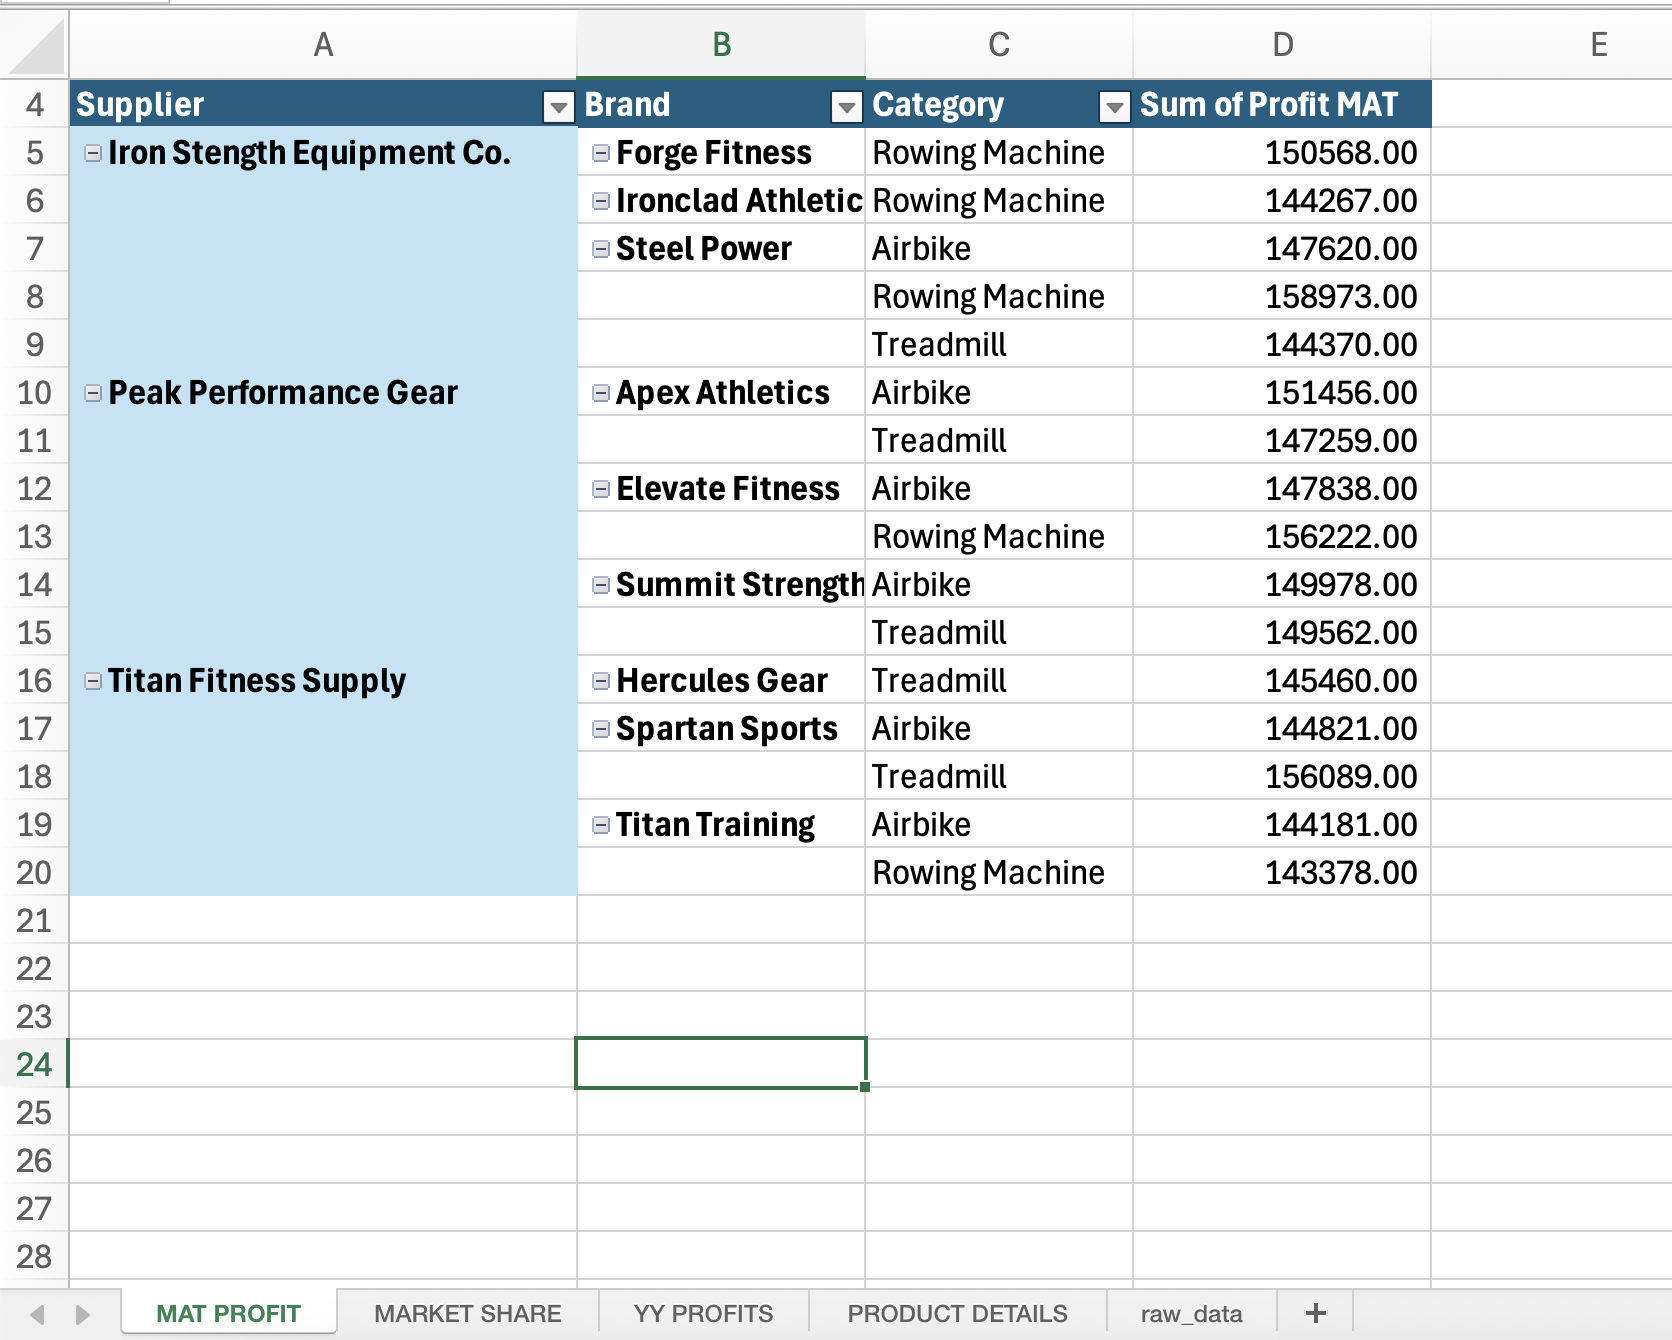
Mat profit
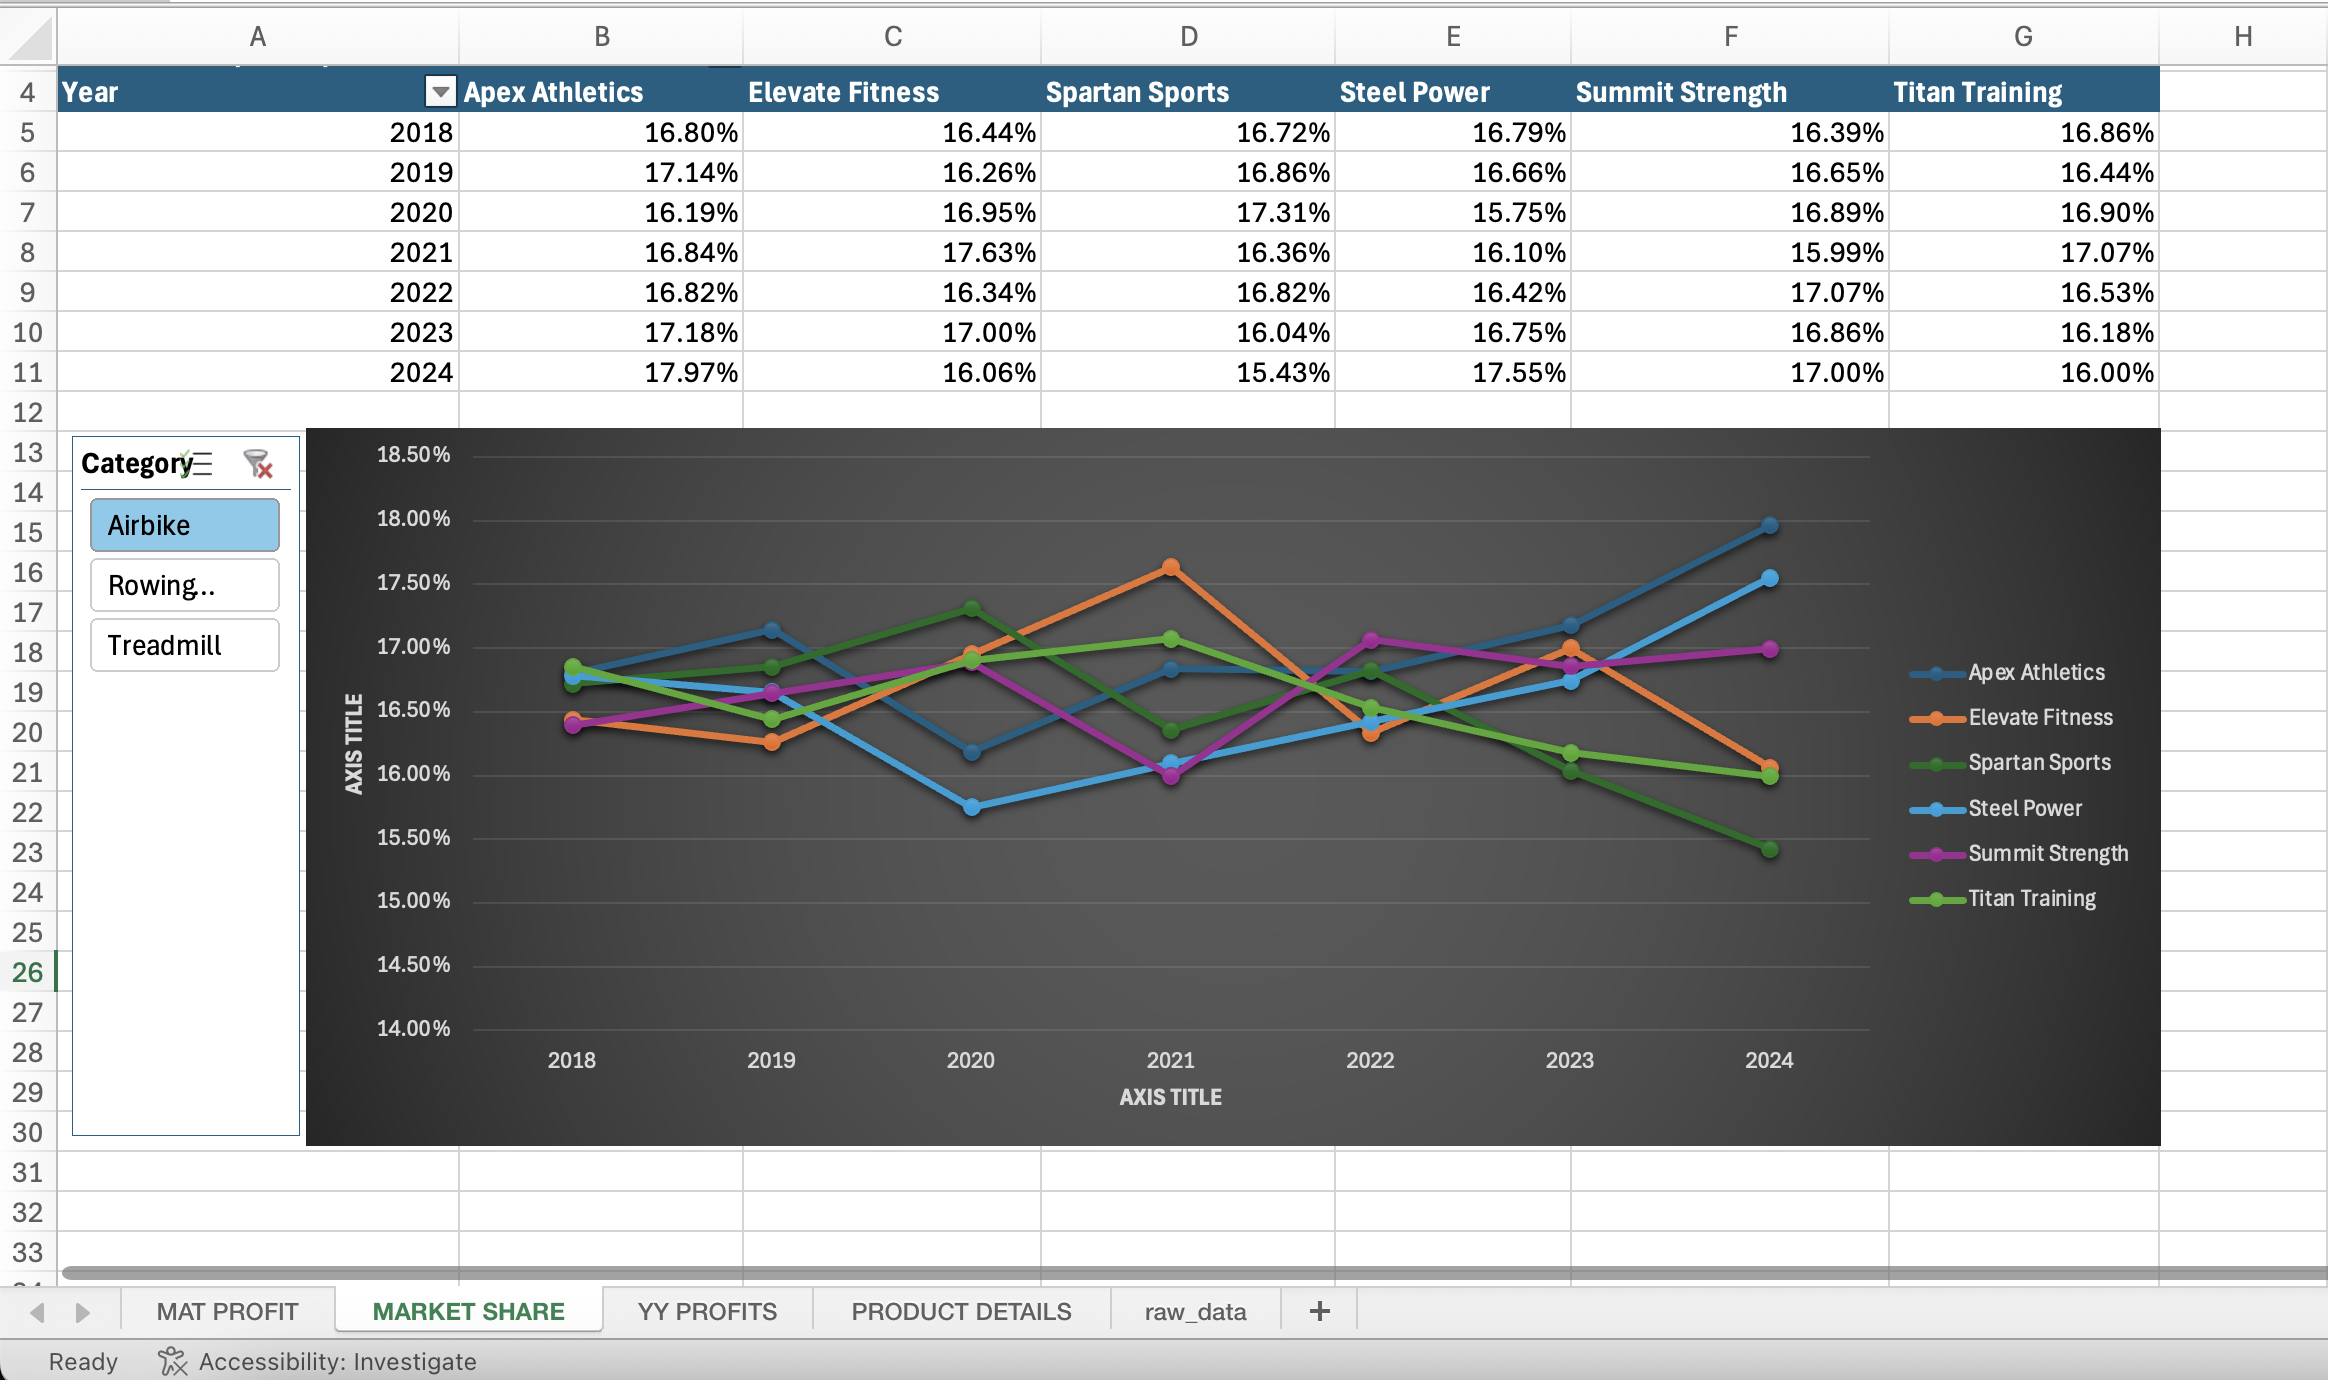
Market Share
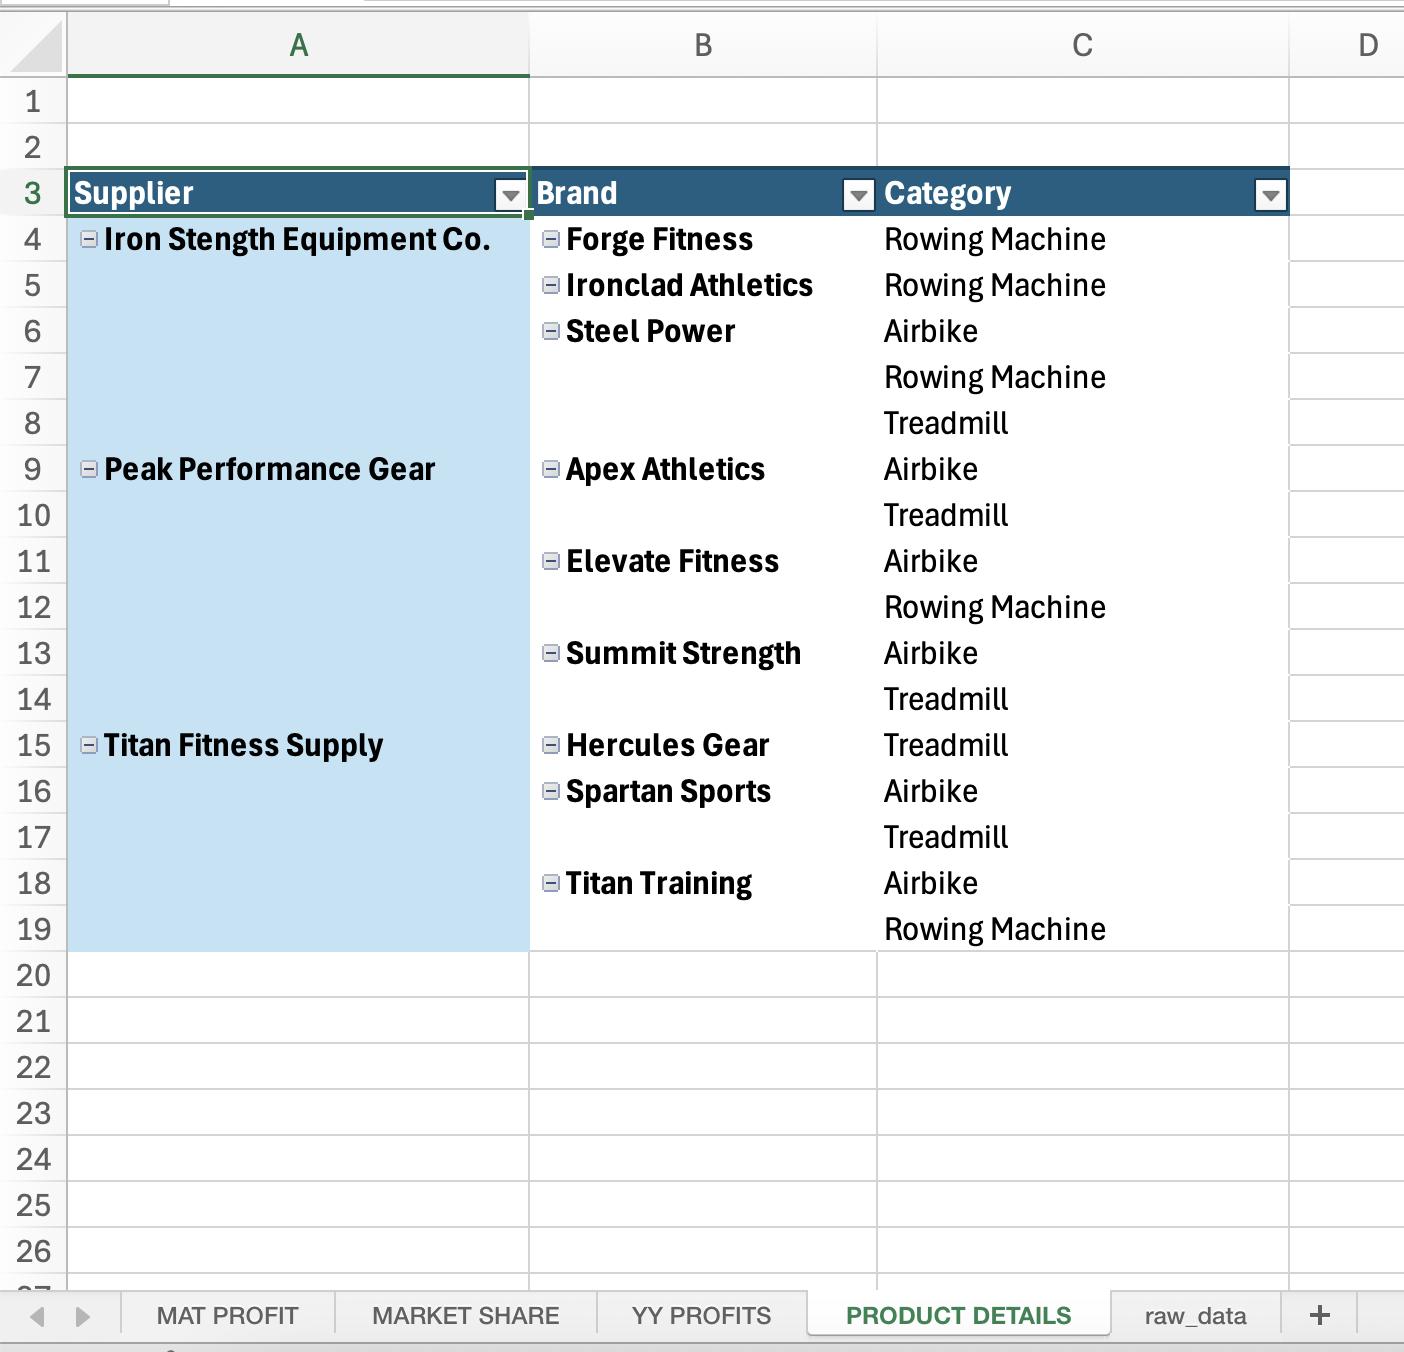
Product Details
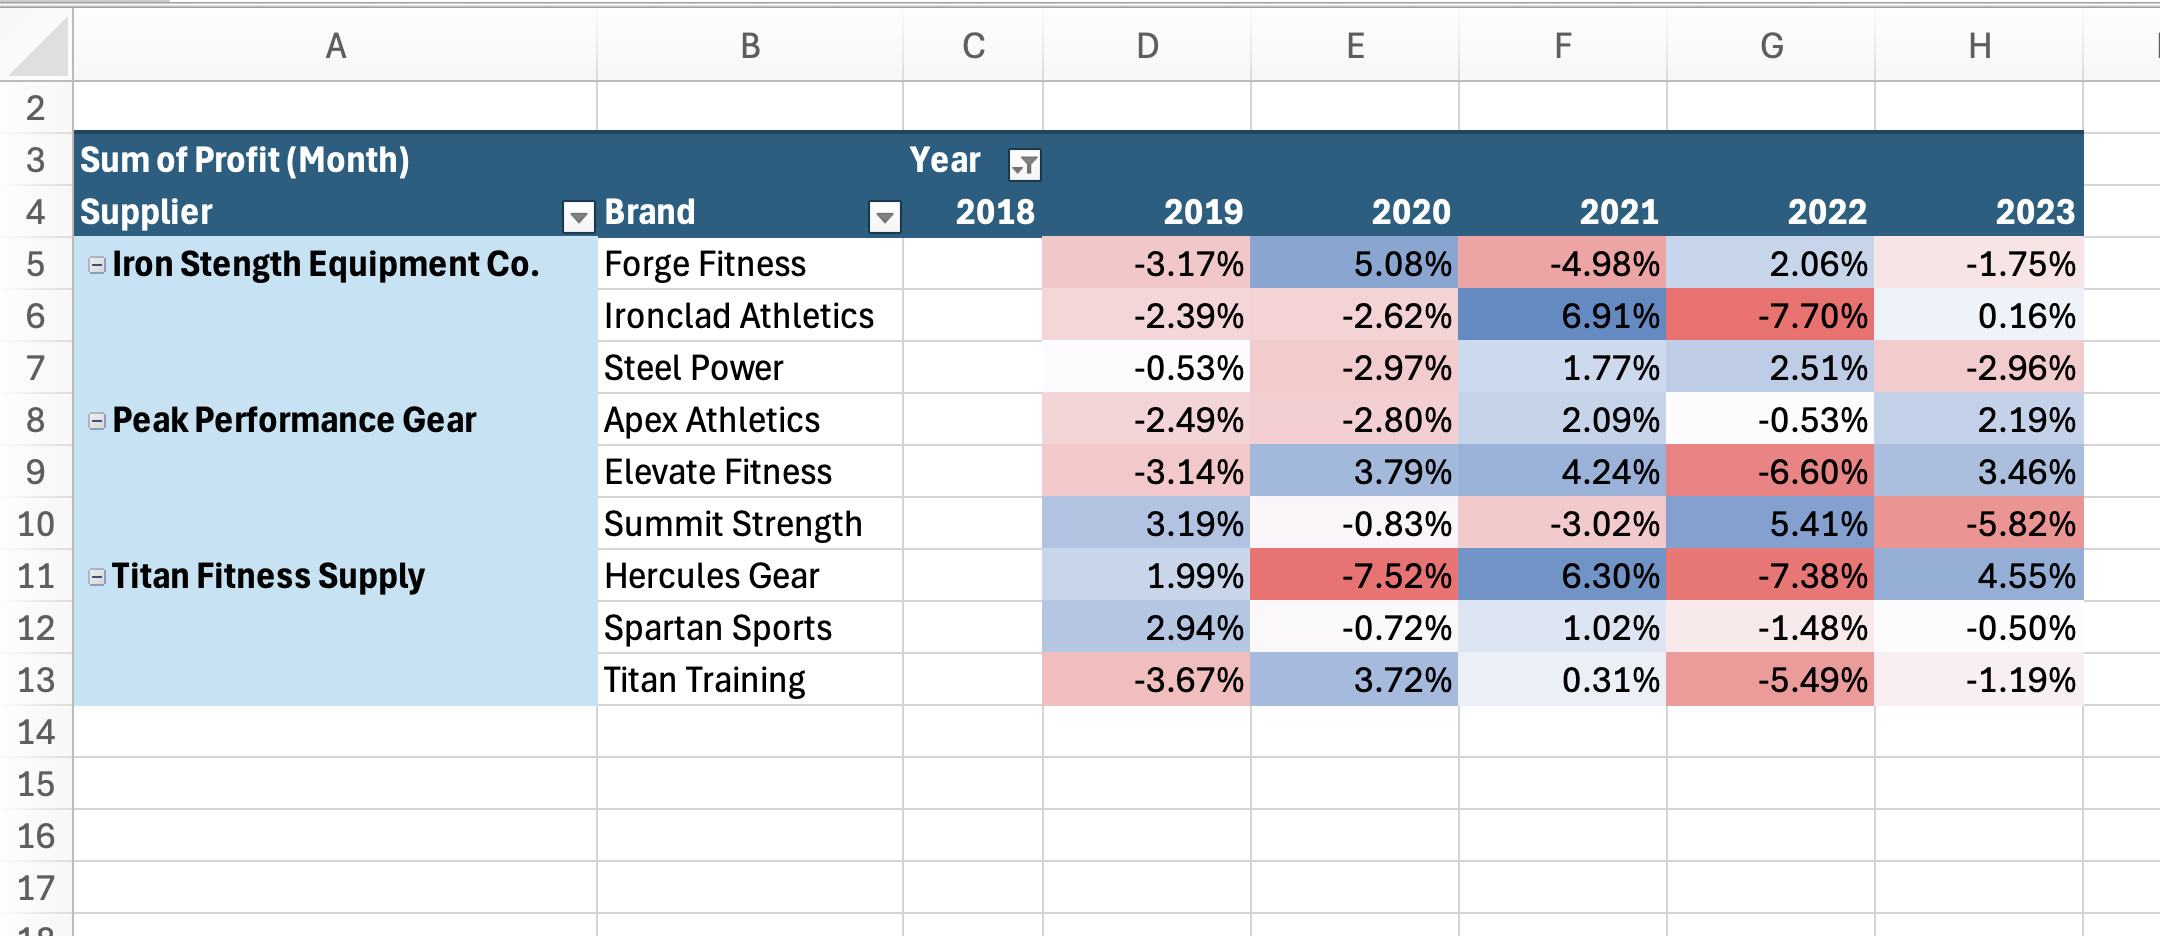
Year over Year profit
Key Dashboard Insights
- Yearly Profitability Trends
- Historical profit trends from 2018–2023 indicate volatility across brands.
- Brands like Steel Power and Titan Training have shown fluctuating returns, while Elevate Fitness and Forge Fitness demonstrated consistent profit growth in recent years.
- A sharp drop in 2022 for multiple brands (e.g., Ironclad Athletics, Hercules Gear) signals a need for strategic reassessment during that period.
- Product Category Performance
- Rowing Machines and Airbikes emerged as consistent revenue drivers across multiple suppliers.
- Treadmill category shows stable profitability, particularly with brands like Steel Power and Titan Training.
- Elevate Fitness and Forge Fitness show strong profit metrics across multiple categories, signalling high cross-category potential.
- Supplier Market Share & Growth
- Iron Strength Equipment Co. leads with the highest overall MAT profit contribution, with Steel Power as its top-performing brand.
- Peak Performance Gear demonstrates balanced growth, especially in the Airbike category with Apex Athletics and Elevate Fitness.
- Titan Fitness Supply offers a competitive range, but opportunities exist to improve profitability for brands like Titan Training and Spartan Sports.
- Supplier & Brand Contribution
- Steel Power (under Iron Strength Equipment Co.) ranks highest in MAT profit ($158,973), indicating strong brand equity and market penetration.
- Brands with declining year-over-year performance like Summit Strength and Hercules Gear need targeted interventions or repositioning.
- Brands such as Elevate Fitness and Apex Athletics have high potential to be scaled further, based on their strong 2024 MAT profitability.
Actionable Recommendations
- Boost Profitable Brands: Increase investment and marketing for top brands like Steel Power, Forge Fitness, and Elevate Fitness.
- Explore Brand Realignment: Underperformers such as Titan Training may benefit from repositioning or product revamps.
- Diversify Category Presence: Suppliers with limited category spread can expand offerings (e.g., more Airbike and Treadmill options for Titan Fitness Supply).
- Encourage Cross-Supplier Competition: Use brand-wise performance data to introduce high-performing brands across other suppliers to create healthy competition.
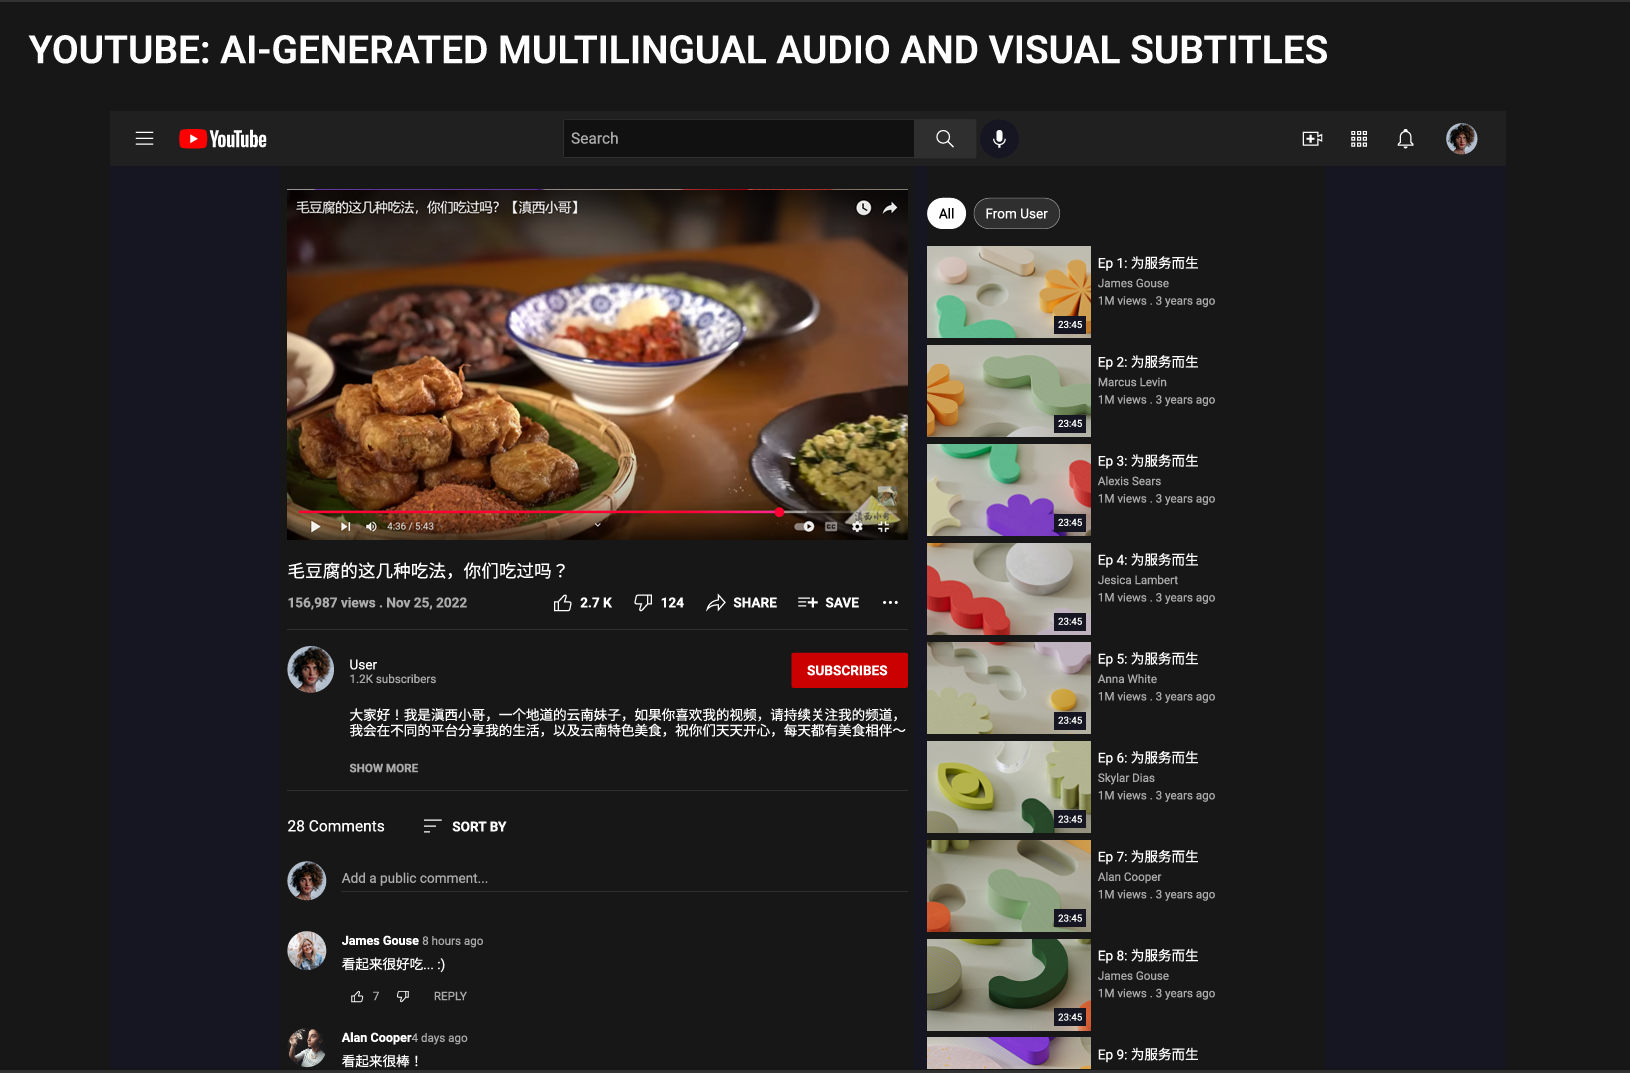 Youtube: proposing multilingual audio and video subtitles using LLM