 Sneha Kataria
Overview:
A Tableau-powered dashboard designed to visualize and interpret residential housing trends across King County, Washington. This helps in identifying investment prospects, market patterns, and regional dynamics, offering a data-driven approach to real estate decision-making.
Objectives
- Market Movement Analysis:
Analyse residential property data to highlight demand hotspots and emerging neighbourhoods across the county. - Economic Insight:
Evaluate property prices as indicators of economic growth, cost of living, and future investments. - Regional & Neighbourhood Trends:
Detect micro-market behaviour across various zip codes and regions to understand local drivers of housing demand. - Opportunity Mapping:
Compare property characteristics (e.g., size, condition, view) and pricing to identify high-potential areas for investment based on regional growth and affordability metrics. - Consumer Sentiment:
Examine buying behaviour and sales volume to interpret market perception, urgency to buy, and shifts in purchasing preferences.
Dashboards
Key Insights from Dashboard Visualizations
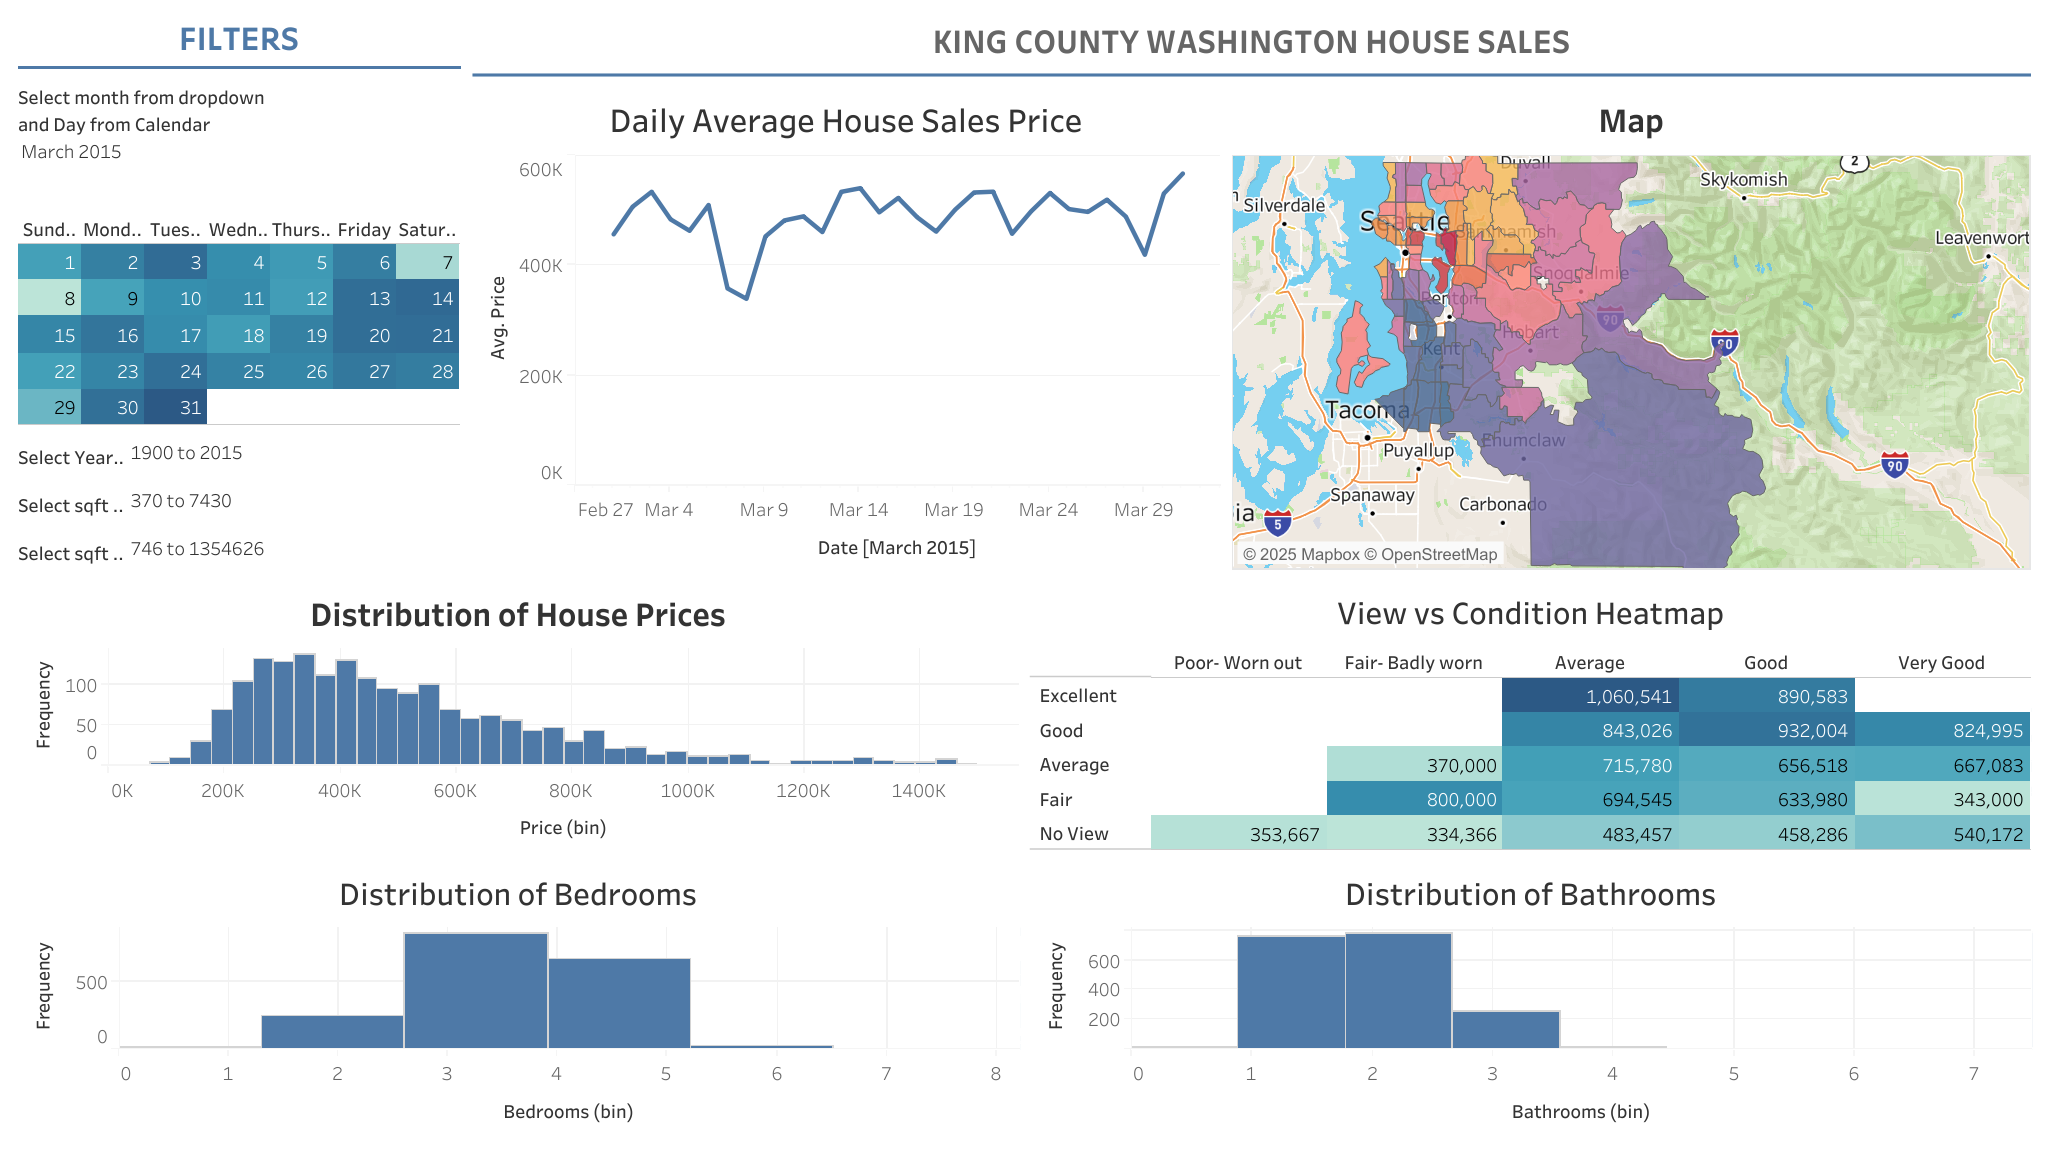
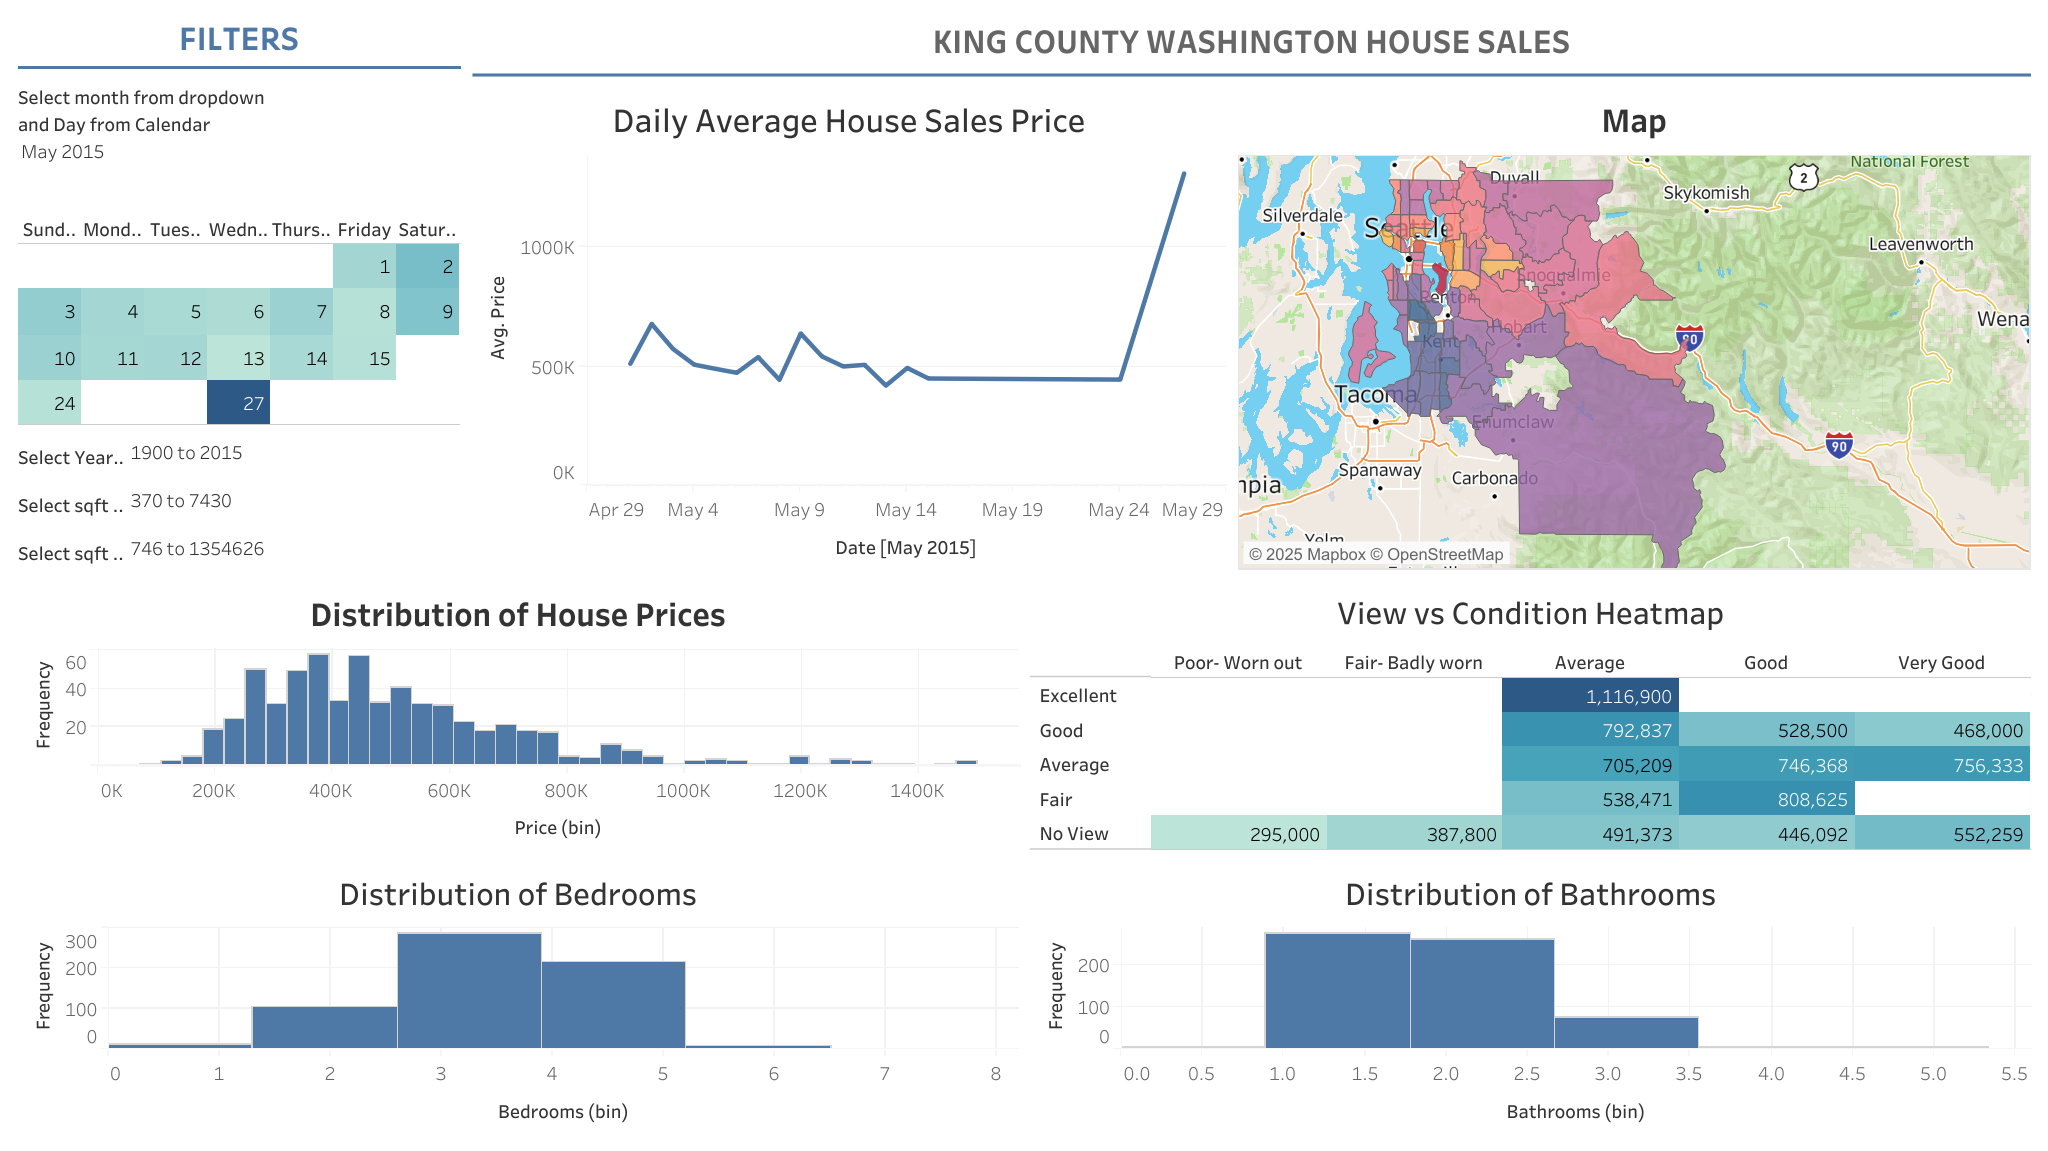
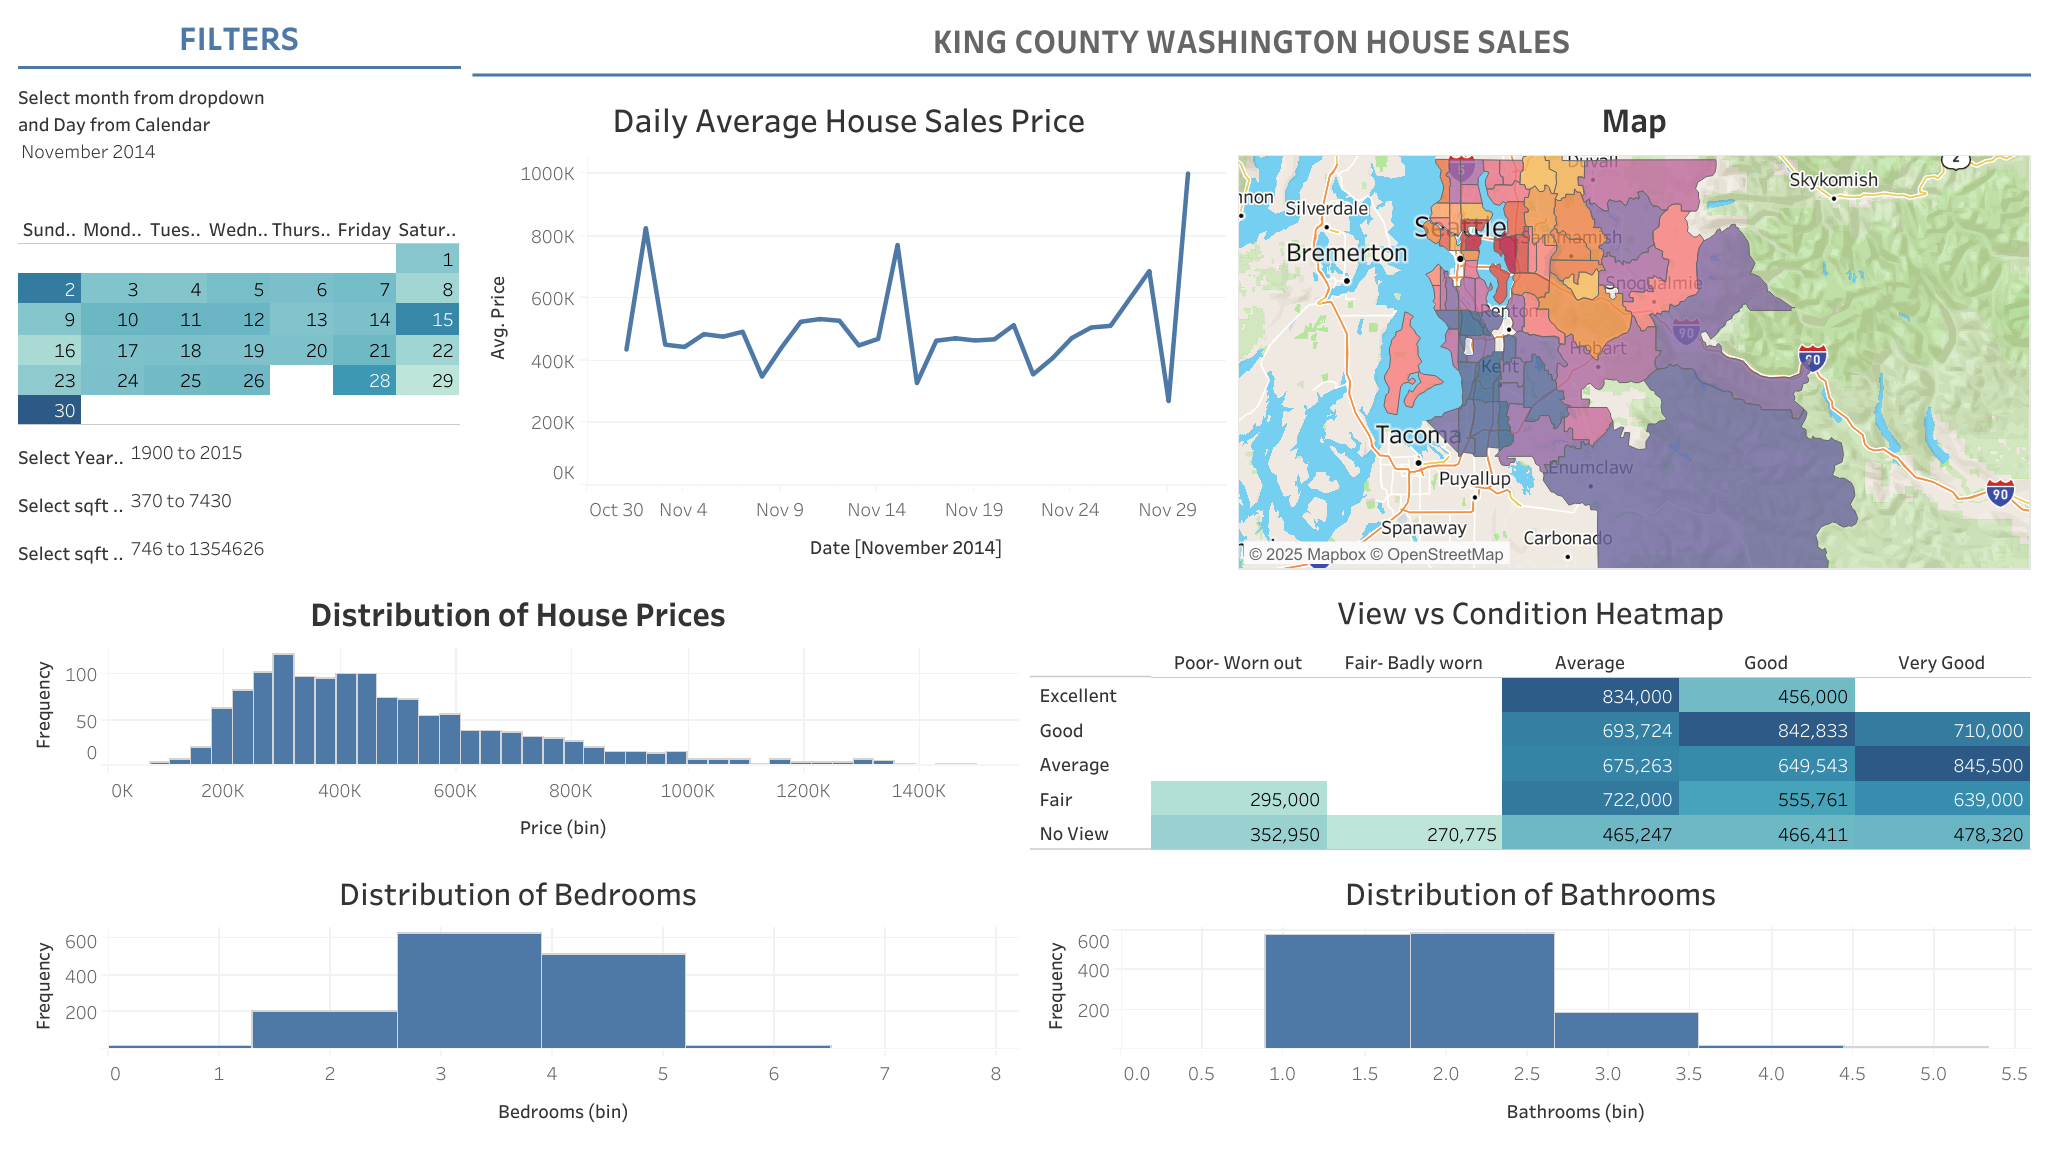
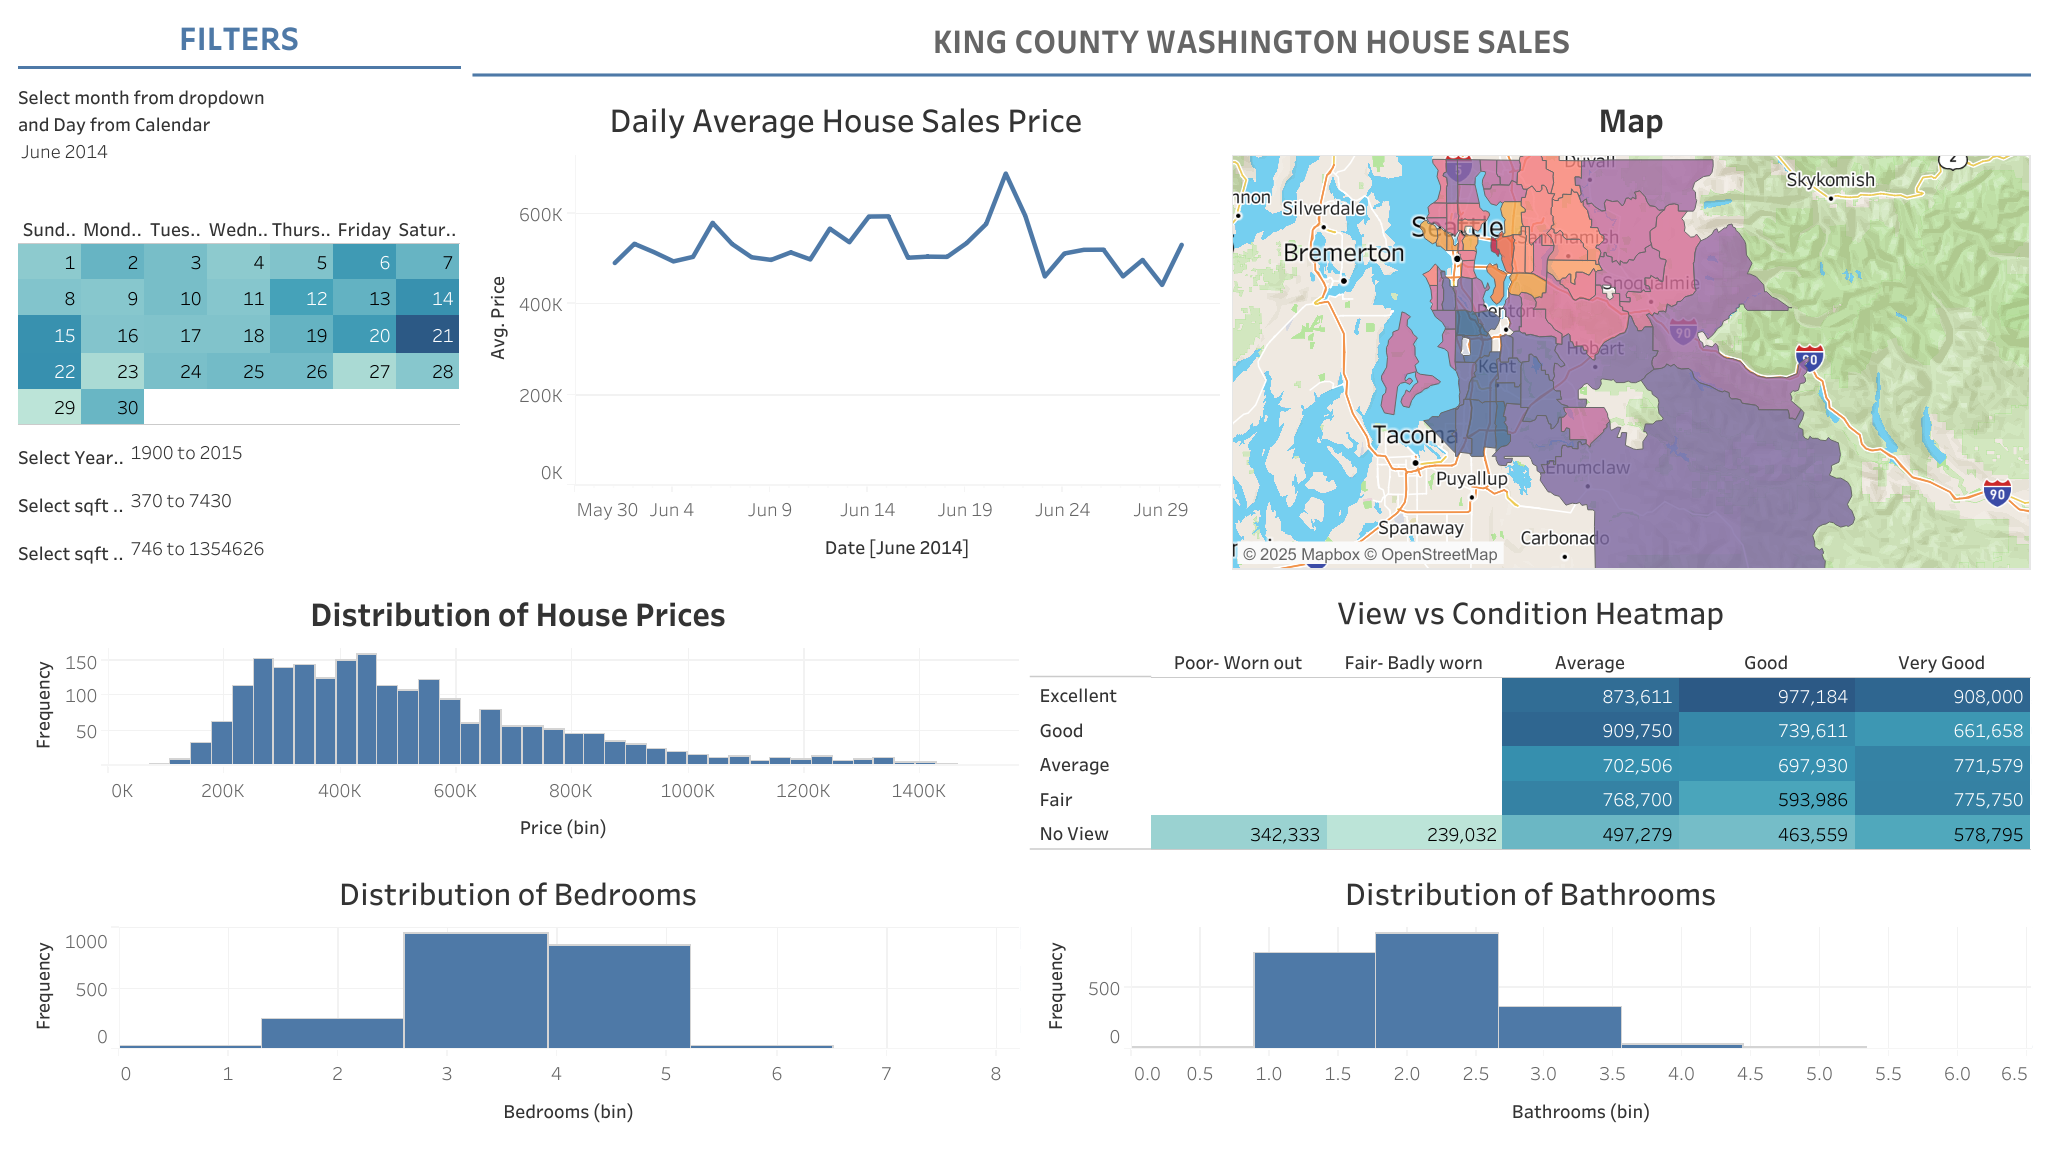
- Temporal Market Trends:
- Daily average sales prices show notable volatility with high demands on specific days, indicating bulk transactions or sales.
- Comparing across months (June 2014, Nov 2014, May 2015), the market shows a general upward trend in average sale prices, suggesting a recovering or improving market.
- Sales Distribution & Price Frequency:
- Most homes fall within the $200K–$600K price range, with a peak around $400K. This indicates a strong middle-market segment.
- Higher frequency of transactions at specific price range shows what buyers are willing and able to afford, essential for pricing strategies.
- Location-Based Demand & Value (Map Visuals):
- Color-coded maps show varying sales concentrations and values across different subregions. Denser areas near Seattle show higher prices, reflecting urban hotspots with proximity to employment hubs.
- Condition & View Analysis (Heatmap):
- Properties in better condition and with great views tend to have significantly higher prices (e.g., ‘Excellent’ condition homes with ‘Very Good’ view reach above $750K–$900K).
- Homes with no views and poor condition fetch lower prices, providing entry points for investors seeking value-add opportunities.
- Property Features – Bedrooms & Bathrooms:
- Most houses have 3–4 bedrooms and 1–2.5 bathrooms, aligning with typical family housing needs.
- This information helps identify target demographics (e.g., families vs. singles) and what types of homes are most in demand.
Strategic Implications for Stakeholders
- Investors: Can focus on mid-priced homes in emerging neighbourhoods with room for value appreciation based on condition and view upgrades.
- Buyers: Gain insights into competitive pricing and which regions offer the best value within their budget.
- Planners & Developers: Use bedroom/bathroom distributions to plan unit mixes that align with market demand.
- Policy Makers: Can analyse affordability and accessibility across regions to address housing equity.
 Finding product market fit for competitive hyperlocal market